
Add your research input
Paste research notes, describe a sketch, or write a prompt that names the process, model, variables, or workflow you want to visualize.
Create research diagram concepts from research notes, a sketch, or a prompt. Guide the subject, setting, visual direction, and destination format so the output fits your study, presentation, or planning task.
AI Research Diagram Generator is a focused creation tool for turning research notes, sketches, or written instructions into research diagram concepts. It is designed for users who need a clear visual starting point for methodology, model, or workflow communication.
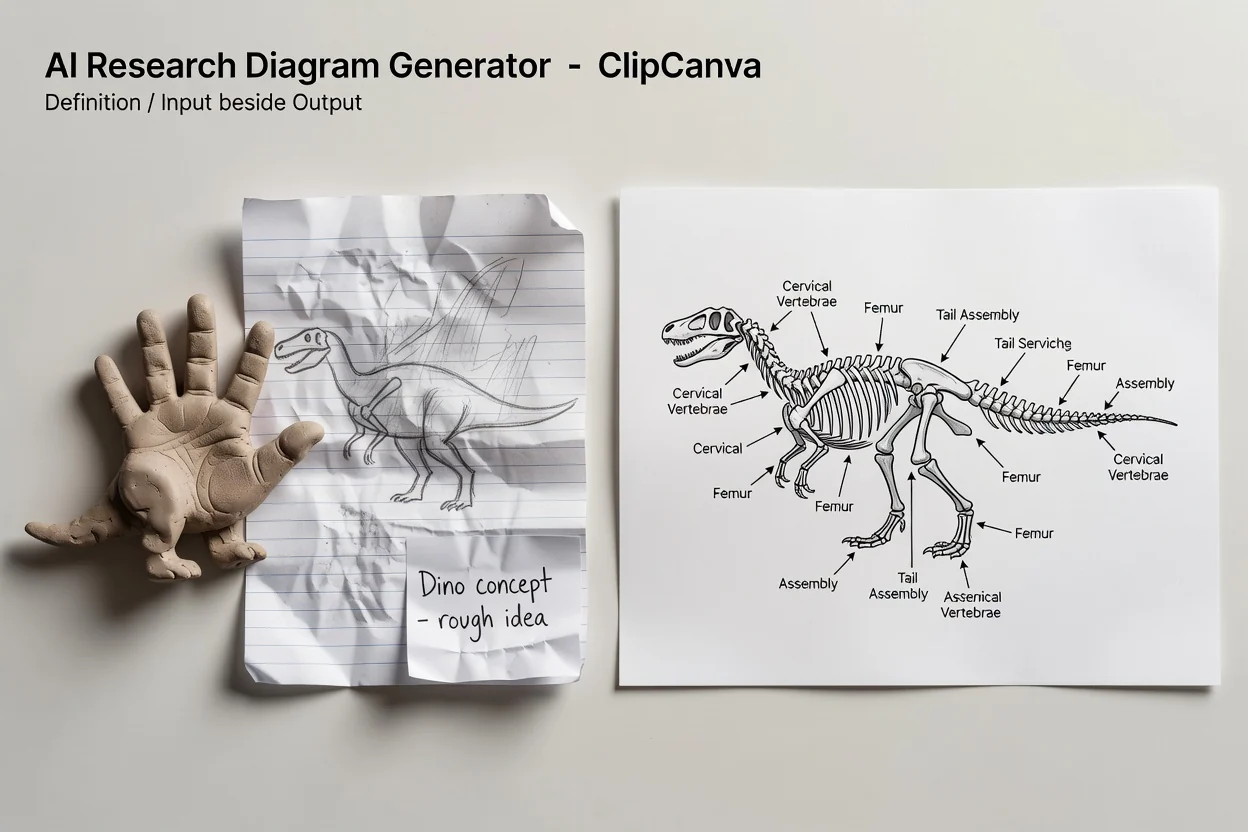
Use a prompt to explain what the diagram should show, then adjust the available controls to guide the research visual.
Paste research notes, describe a sketch, or write a prompt that names the process, model, variables, or workflow you want to visualize.
Set prompt detail, visual direction, subject and setting, and destination format to guide the research diagram maker toward your intended use.
Create with AI Research Diagram Generator, then compare the output with your brief and refine your instructions if the concept needs changes.
The research diagram maker helps shape an image concept around the information you provide, while keeping key creation controls visible before you start.
Describe the study, model, experiment, or process you want represented, then refine the prompt detail to clarify relationships and emphasis.
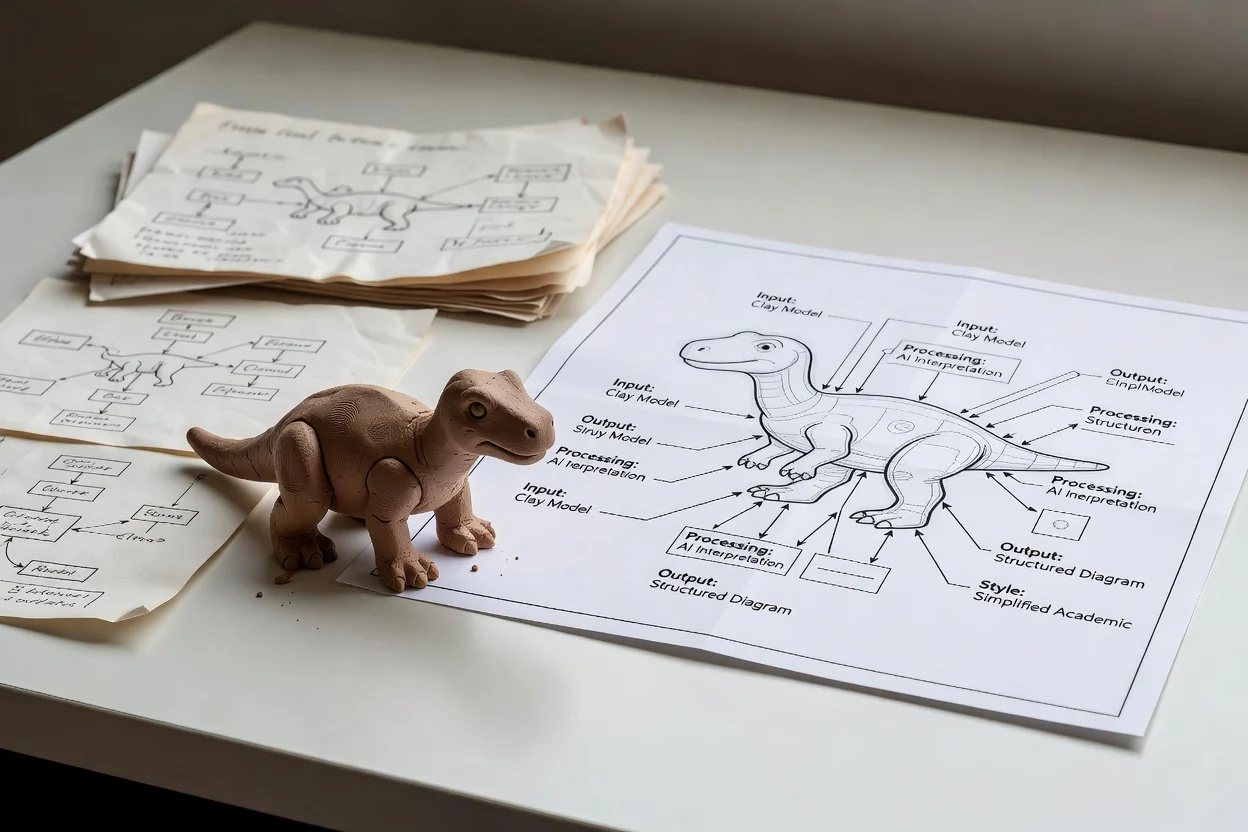
Set a visual direction for the image, such as clean academic, presentation-ready, technical, or simplified for a broader audience.
Specify the subject and setting so the diagram concept reflects the research context instead of a generic graphic.
Use the result as a visual starting point for research communication, planning, or presentation work.
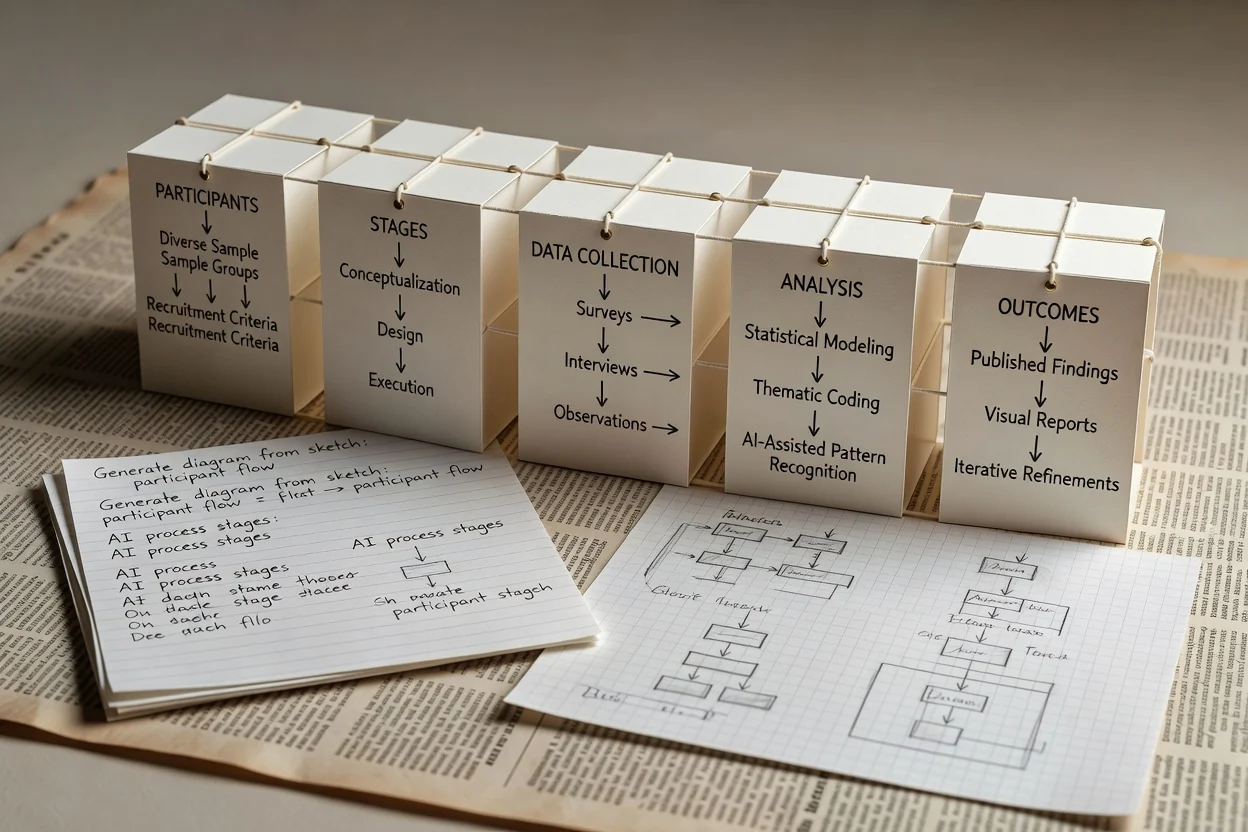
Create a clear methodology diagram that explains participants, stages, data collection, analysis, and outcomes.
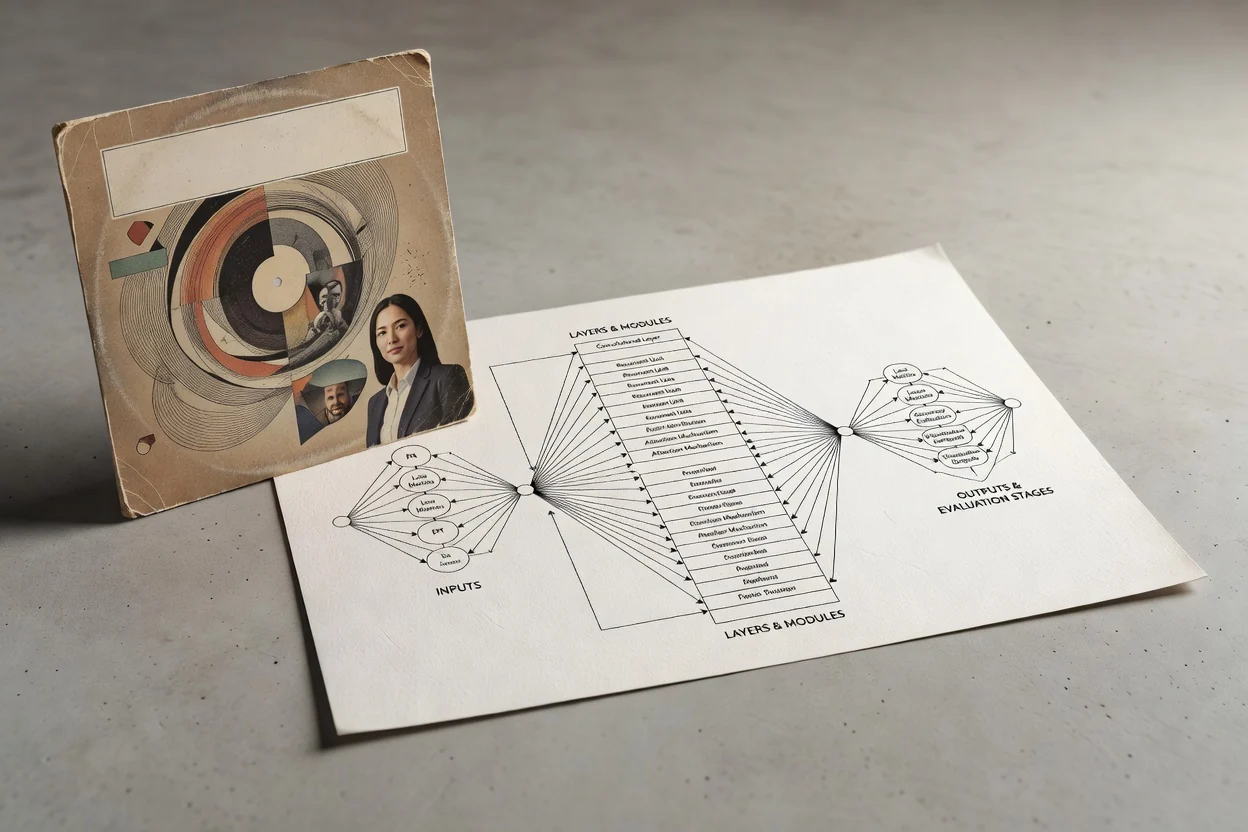
Map a model architecture with inputs, layers, modules, outputs, or evaluation stages for easier explanation.
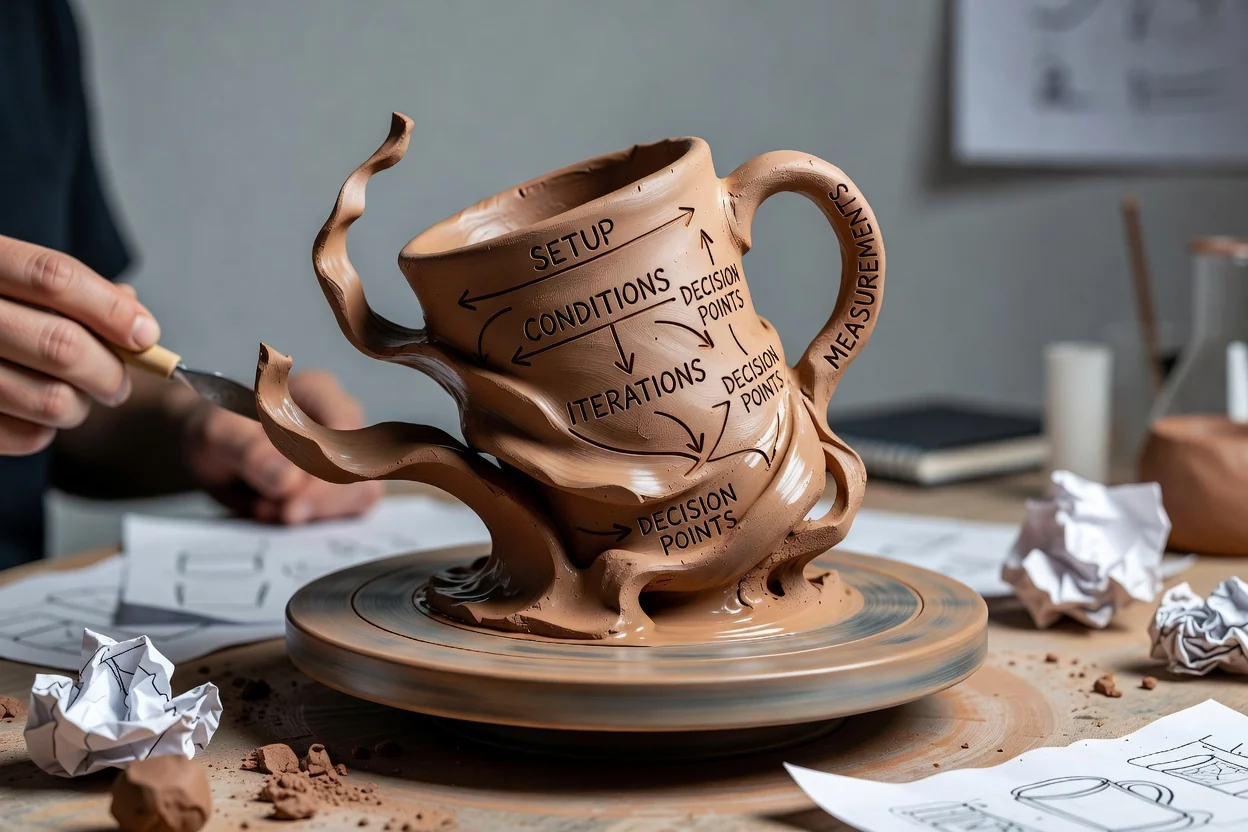
Visualize experiment workflows, including setup, conditions, iterations, measurements, and decision points.
Before you use the output, review the diagram concept against your brief and the practical requirements of its destination.
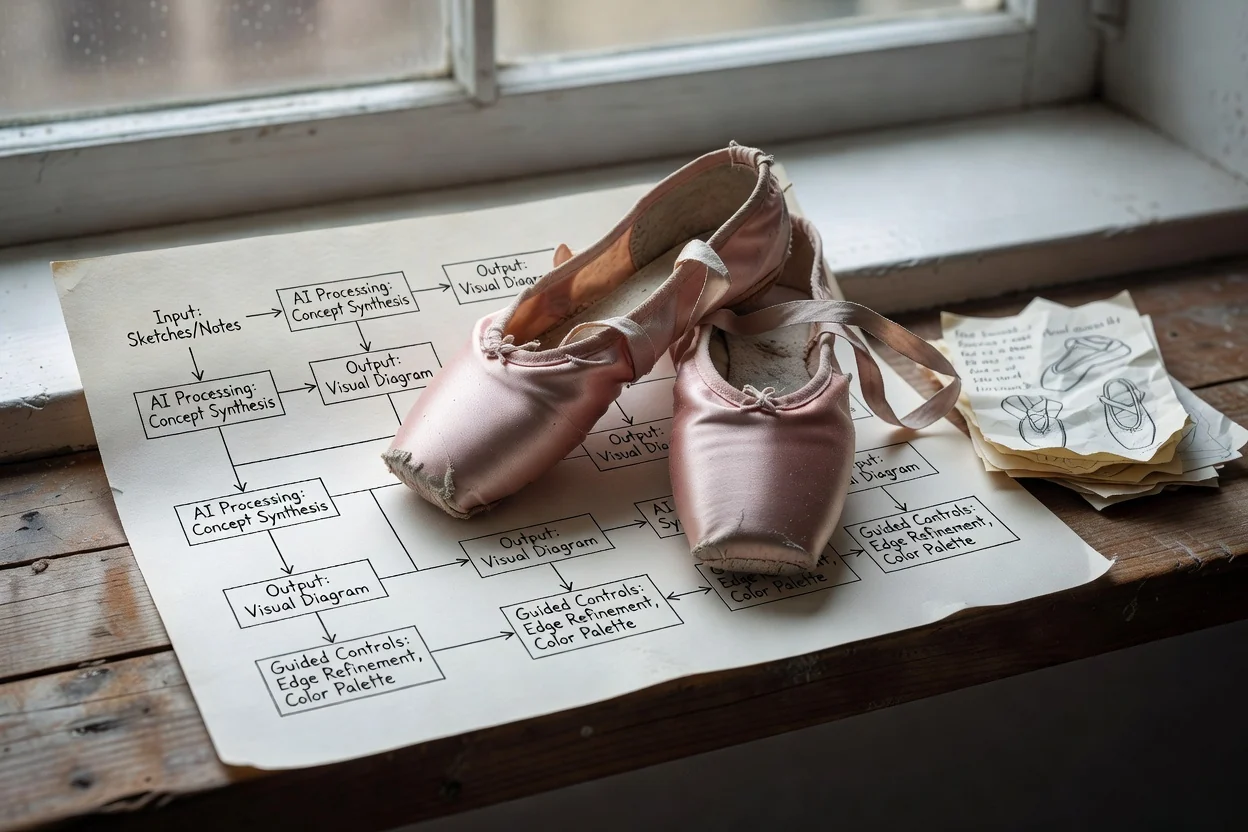
Check whether the diagram concept matches the research objective, audience, and communication task.
Review labels, relationships, sequence, and supporting details so the visual does not miss essential information.
Confirm the destination crop and format before using the result in slides, documents, or web layouts.
AI-generated results can vary, and research visuals should be checked before use in presentations, reports, or planning documents.
The same brief may produce different diagram concepts, so choose the result that best matches your research goal.
Important details, labels, relationships, and visual emphasis require review, especially for complex methods or model structures.
Answers to common questions about using AI Research Diagram Generator for research-focused visual planning.
Create with AI Research Diagram Generator using your research notes, sketch, or prompt, then review the diagram concept before placing it into your project.