
הוסיפו את הקלט המחקרי שלכם
הדביקו הערות מחקר, תארו סקיצה או כתבו הנחיה המציינת את התהליך, המודל, המשתנים או תהליך העבודה שתרצו להמחיש.
צרו רעיונות לתרשימי מחקר מתוך הערות מחקר, סקיצה או הנחיה. כוונו את הנושא, ההקשר, הכיוון החזותי ותבנית היעד, כדי שהתוצאה תתאים למחקר, למצגת או למשימת התכנון שלכם.
מחולל תרשימי מחקר בבינה מלאכותית הוא כלי יצירה ממוקד שהופך הערות מחקר, סקיצות או הוראות כתובות לרעיונות לתרשימי מחקר. הוא מיועד למשתמשים הזקוקים לנקודת פתיחה חזותית ברורה להצגת מתודולוגיה, מודל או תהליך עבודה.
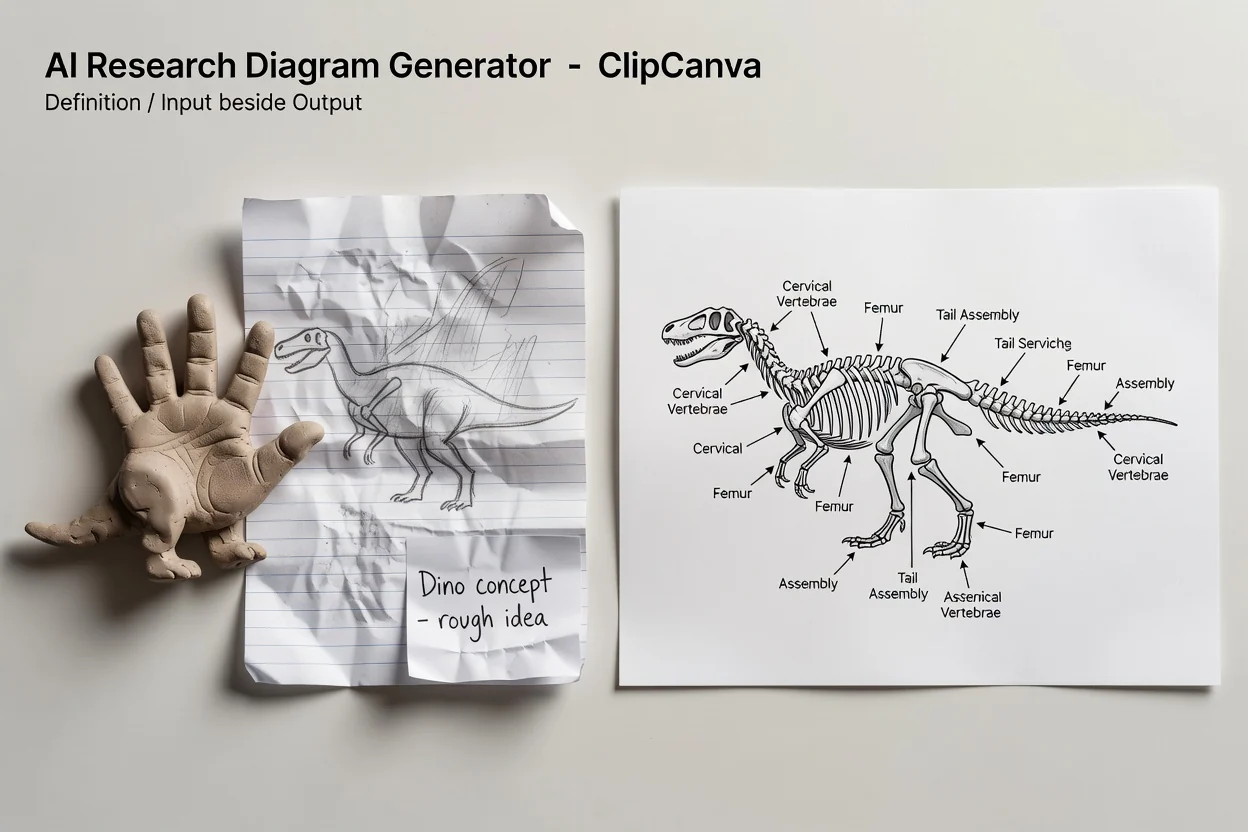
השתמשו בהנחיה כדי להסביר מה התרשים אמור להציג, ואז התאימו את הפקדים הזמינים כדי לכוון את החזותי המחקרי.
הדביקו הערות מחקר, תארו סקיצה או כתבו הנחיה המציינת את התהליך, המודל, המשתנים או תהליך העבודה שתרצו להמחיש.
הגדירו את פירוט ההנחיה, הכיוון החזותי, הנושא וההקשר ותבנית היעד, כדי לכוון את הכלי ליצירת תרשימי מחקר לשימוש המיועד שלכם.
צרו באמצעות מחולל תרשימי מחקר בבינה מלאכותית, השוו את התוצאה לתקציר שלכם וחדדו את ההוראות אם הרעיון דורש שינויים.
הכלי ליצירת תרשימי מחקר מסייע לעצב רעיון לתמונה סביב המידע שתספקו, תוך שמירה על פקדי יצירה מרכזיים גלויים לפני שמתחילים.
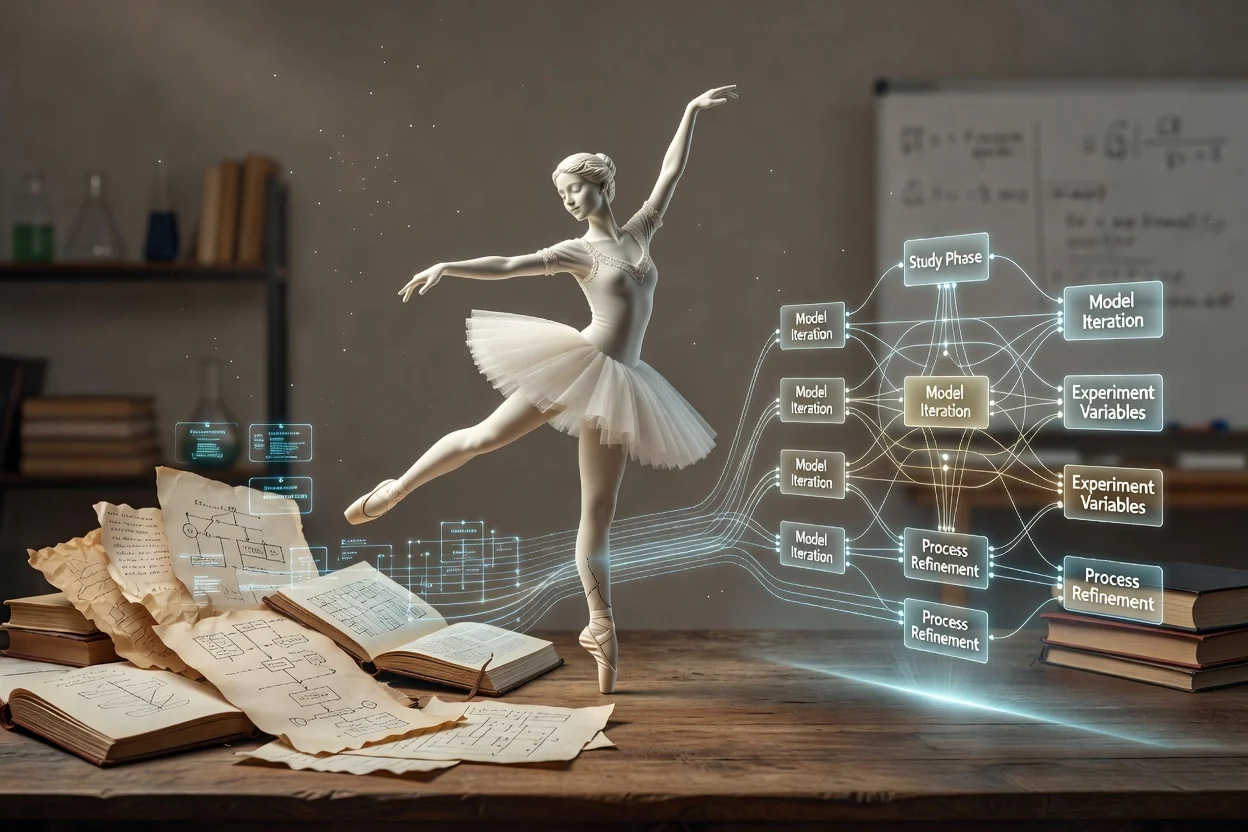
תארו את המחקר, המודל, הניסוי או התהליך שתרצו לייצג, ואז חדדו את פירוט ההנחיה כדי להבהיר קשרים ודגשים.
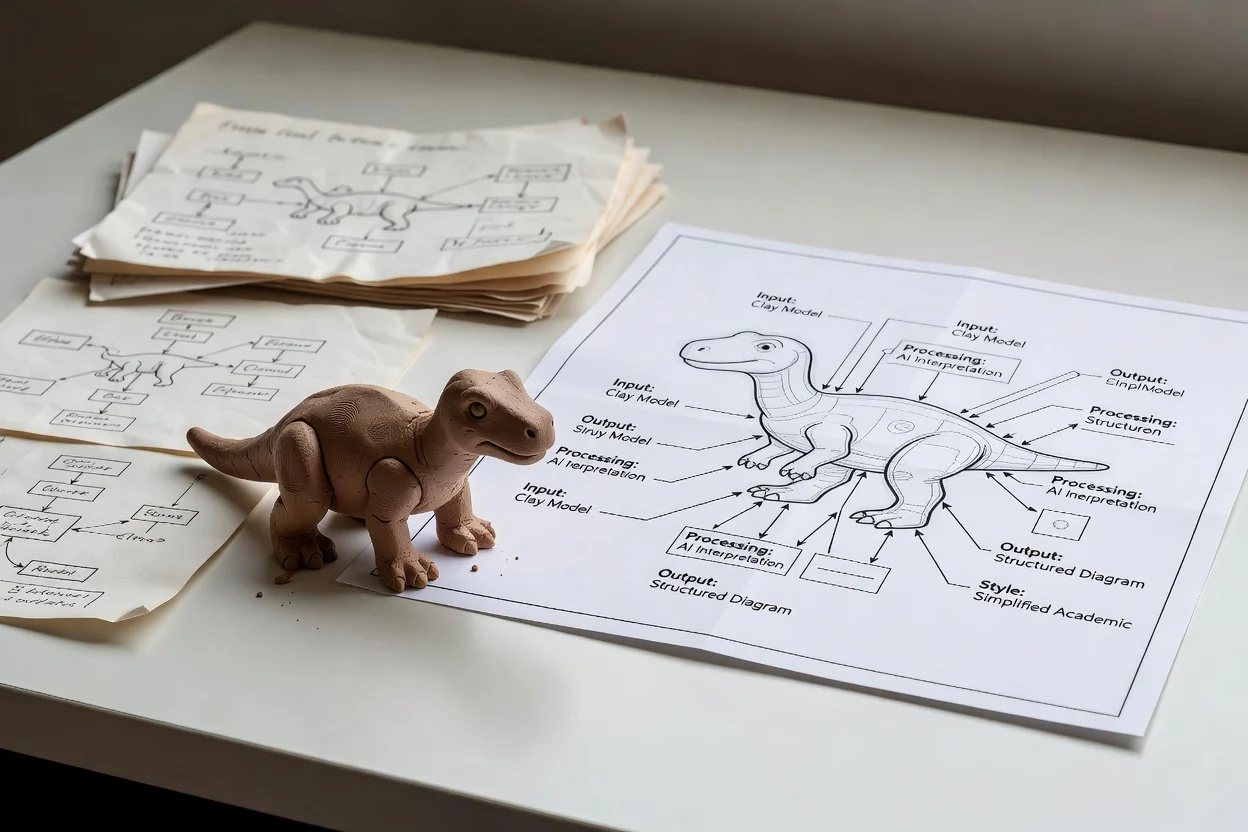
הגדירו כיוון חזותי לתמונה, למשל אקדמי נקי, מוכן למצגת, טכני או מפושט לקהל רחב יותר.
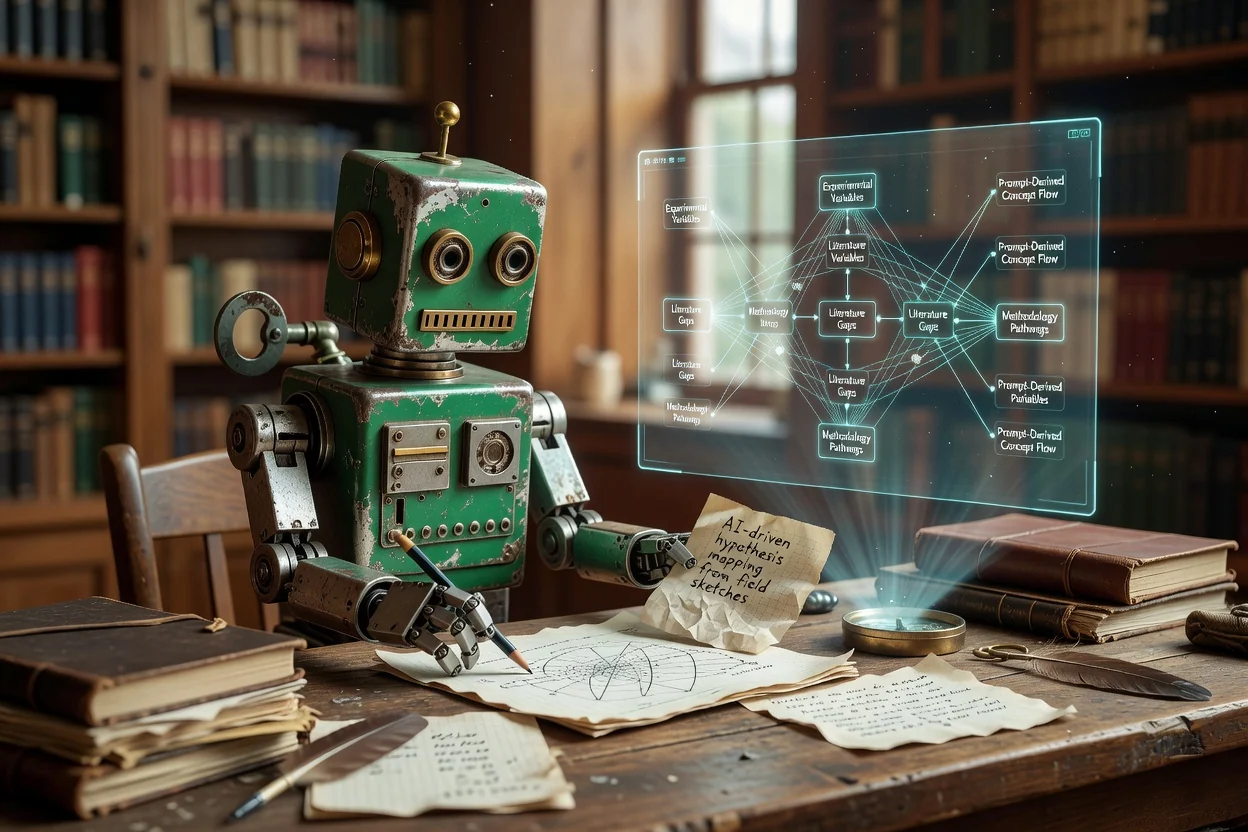
ציינו את הנושא וההקשר כדי שרעיון התרשים ישקף את הקשר המחקרי ולא גרפיקה כללית.
השתמשו בתוצאה כנקודת פתיחה חזותית לתקשור מחקרי, תכנון או עבודה על מצגת.
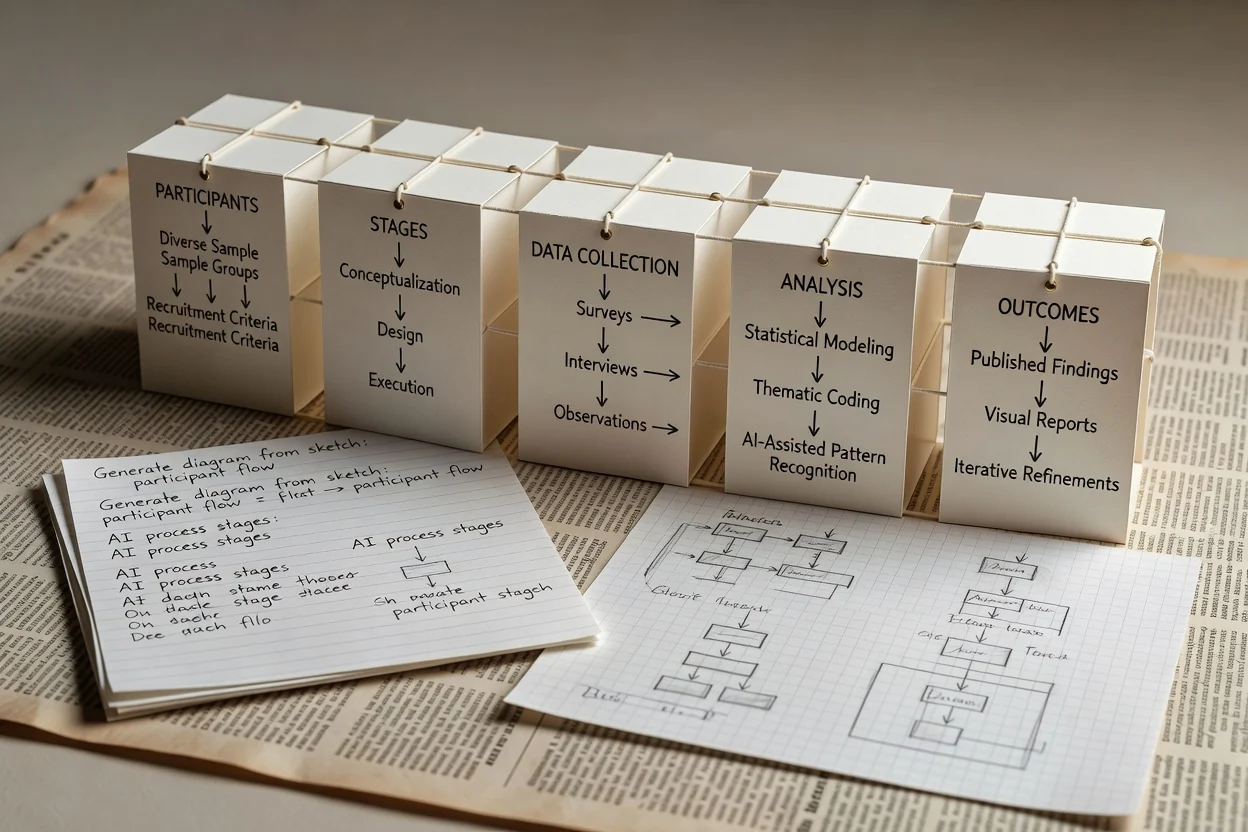
צרו תרשים מתודולוגיה ברור המסביר משתתפים, שלבים, איסוף נתונים, ניתוח ותוצאות.
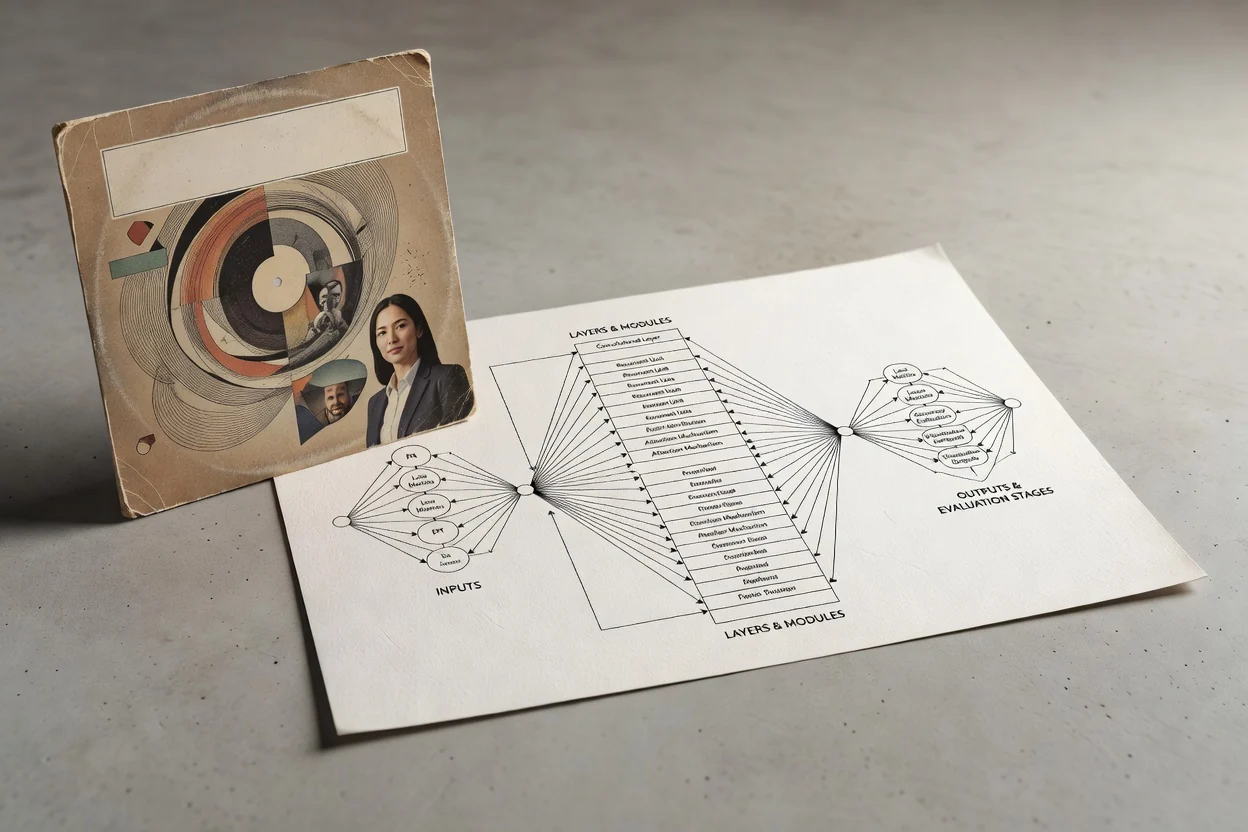
מפו ארכיטקטורת מודל עם קלטים, שכבות, מודולים, פלטים או שלבי הערכה, כדי להקל על ההסבר.
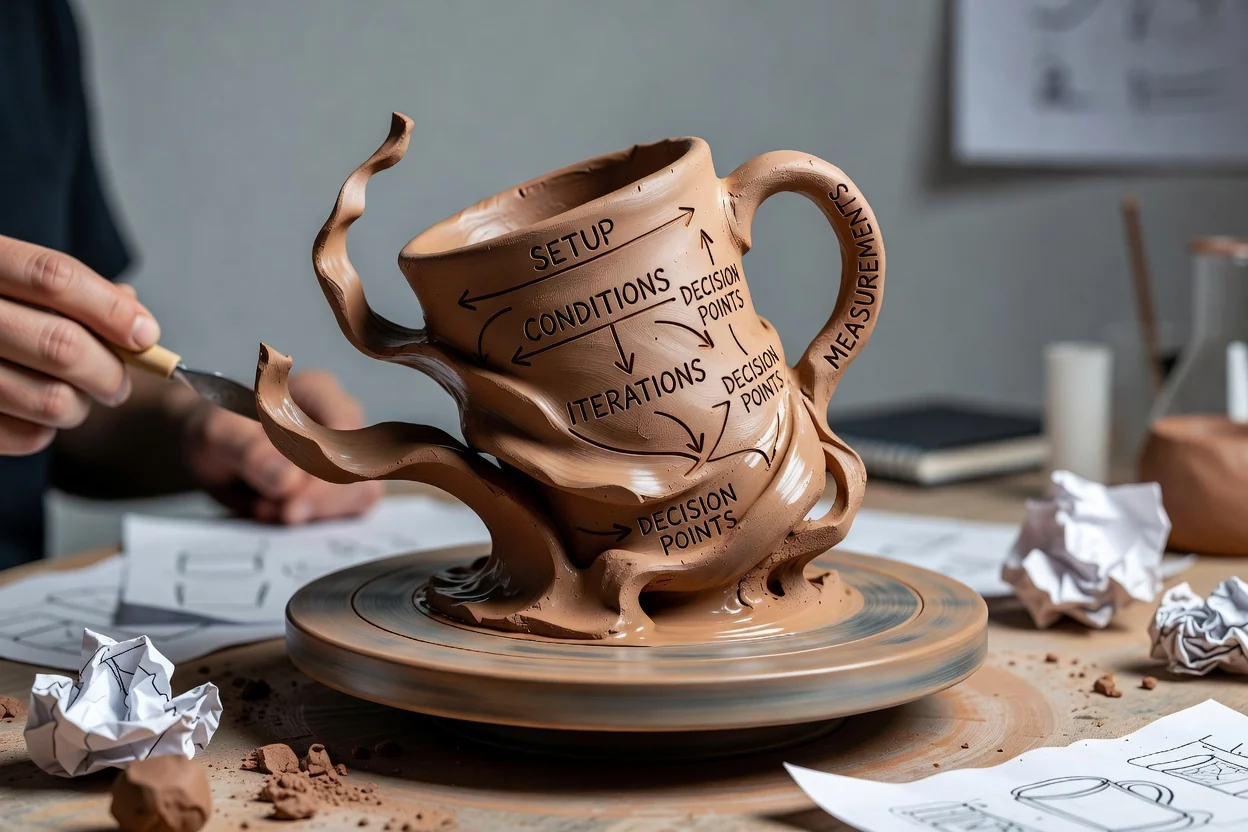
המחישו תהליכי עבודה של ניסויים, כולל הכנה, תנאים, איטרציות, מדידות ונקודות החלטה.
לפני השימוש בתוצאה, בדקו את רעיון התרשים מול התקציר שלכם והדרישות המעשיות של היעד שלו.
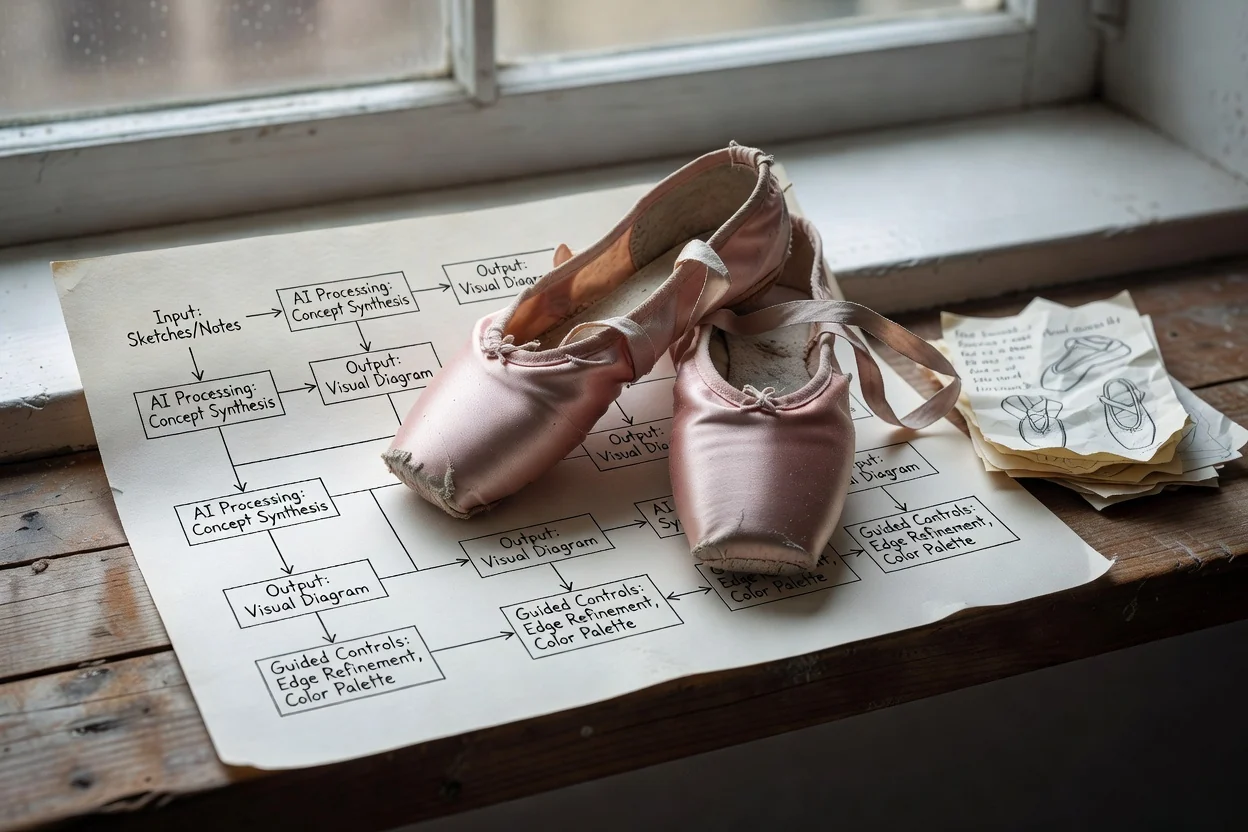
בדקו אם רעיון התרשים תואם את מטרת המחקר, הקהל ומשימת התקשור.
בדקו תוויות, קשרים, רצף ופרטים תומכים, כדי שהחזותי לא יחמיץ מידע חיוני.
אשרו את החיתוך ותבנית היעד לפני השימוש בתוצאה בשקופיות, במסמכים או בפריסות אינטרנט.
תוצאות שנוצרו בבינה מלאכותית עשויות להשתנות, ויש לבדוק חזותיים למחקר לפני השימוש בהם במצגות, בדוחות או במסמכי תכנון.
אותו תקציר עשוי להפיק רעיונות שונים לתרשימים, לכן בחרו בתוצאה שהכי תואמת את מטרת המחקר שלכם.
פרטים חשובים, תוויות, קשרים ודגשים חזותיים דורשים בדיקה, במיוחד במתודות מורכבות או במבני מודלים.
תשובות לשאלות נפוצות על השימוש במחולל תרשימי מחקר בבינה מלאכותית לתכנון חזותי ממוקד מחקר.
צרו בעזרת מחולל תרשימי מחקר בבינה מלאכותית מתוך הערות המחקר, הסקיצה או ההנחיה שלכם, ואז בדקו את רעיון התרשים לפני שילובו בפרויקט.