ClipCanva

How to Write a Clear AI Research Diagram Prompt

Write an AI research diagram prompt that names the real components, relationships, layout, and review constraints—without asking the generator to invent research details.

July 26, 2026ClipCanva Editorial
How to Write a Clear AI Research Diagram Prompt

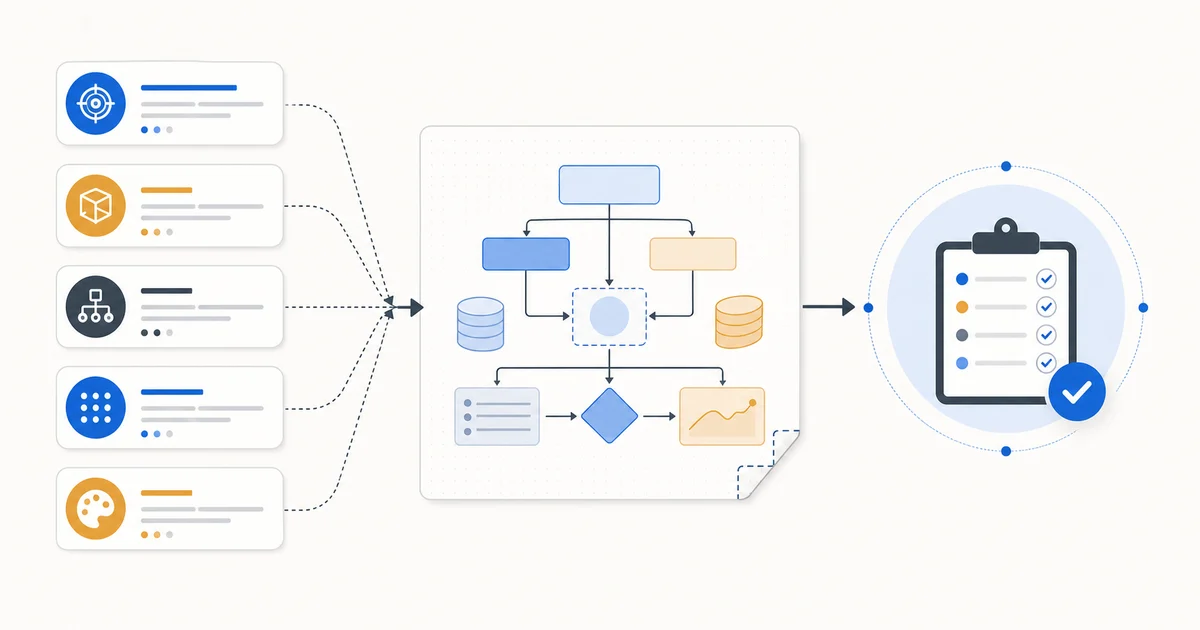
A clear research diagram prompt is a compact design brief, not a request to reconstruct missing research. It tells the generator which verified components belong in the visual, how they connect, and what must be reviewed before the diagram represents your work.

The goal is a visual draft with a readable hierarchy. You remain responsible for the source material, the research meaning, and the final labels.

Start with a verified diagram brief

Before writing the prompt, collect the details that should appear in the figure:

  • The single idea the diagram should explain.
  • The inputs, stages, components, and outputs that the source explicitly names.
  • Relationships that must be visible: sequence, branch, comparison, dependency, or feedback.
  • Exact terms, units, abbreviations, or citations that need a separate factual check.
  • The intended reader: a lab colleague, a technical reviewer, a student, or a general audience.

Do not ask the generator to supply missing research details. If you cannot state a component or relationship clearly, return to the paper, experiment notes, system specification, or subject-matter reviewer before you generate the image.

Use seven fields in every prompt

Good diagram prompts are easier to revise when they separate the research structure from the visual treatment.

Field What to write
Goal One sentence describing what the reader should understand.
Audience Who will read the figure and how much context they already have.
Components The verified nodes, stages, or groups that must be present.
Relationships The exact order, arrows, branches, comparisons, or loops.
Layout A left-to-right flow, layered architecture, central hub, or another structure that fits the source.
Visual direction The hierarchy, grouping, color restraint, and amount of detail.
Constraints What may not be invented, changed, or presented as a data result.

Use plain names for components. “Retriever,” “vector store,” and “response evaluator” are more useful than “smart AI modules.” Specific names make it easier for you to notice whether a result drifted from the source.

Copy this research diagram prompt template

Replace the bracketed text with facts you have already checked.

Create a clear research diagram for [audience].

Goal: explain [one verified idea].
Components: [component 1], [component 2], [component 3].
Relationships: [describe the order and each connection in words].
Output: [verified endpoint or artifact].
Layout: [left-to-right flow, layered architecture, central hub, or another structure].
Visual direction: clean academic hierarchy, concise labeled groups, restrained color accents, ample spacing.
Labels that must remain exact: [terms, units, abbreviations].
Constraint: use only the components and relationships listed above. Do not add facts, measurements, citations, labels, or results. Treat the output as a visual draft for source review.

This structure works for a methodology flow, model architecture, experiment workflow, or system overview. Change the fields, not the research facts, when you want a new visual direction.

Example: a system architecture prompt

Here is a fictional structure showing the level of specificity to aim for. Replace it with your own verified system description rather than copying the names into a real paper.

Create a layered architecture diagram for technical reviewers.

Goal: explain how a user question moves through a retrieval-assisted response workflow.
Components: user question, query encoder, document index, retrieval step, context builder, language model, response checker, final response.
Relationships: the user question enters the query encoder; the encoder queries the document index; retrieved passages enter the context builder; the context builder sends the combined prompt to the language model; the response checker reviews the model output before the final response is returned.
Layout: left-to-right with a separate lower lane for retrieved passages moving from the document index to the context builder.
Visual direction: technical but uncluttered, grouped stages, short labels, neutral background, one accent color for the retrieval lane.
Constraint: do not add performance scores, data volumes, citations, or unlisted components. Treat the output as a visual draft for source review.

The useful detail is not the style phrase. It is the explicit path between components, the separate lane for the supporting context, and the limit on unlisted claims.

Describe relationships in words before using arrows

Arrows can be ambiguous when a prompt only lists components. Add a short sentence for every meaningful connection:

  • “The cleaned data enters the feature extraction stage.”
  • “The baseline and proposed method receive the same input, then feed separate evaluation paths.”
  • “The reviewer can return a rejected output to the revision stage.”

If two boxes merely sit near each other, do not imply a causal or sequential relationship with an arrow. This is especially important when a diagram is used to explain a method, model, or experimental workflow.

Add layout constraints only after the facts are clear

Layout direction helps a reader scan the image, but it cannot correct an unclear method. Choose a layout that matches the actual structure:

  • Use a linear flow for a defined sequence.
  • Use layers for an architecture with distinct input, processing, and output levels.
  • Use parallel columns for a comparison that keeps the same inputs or evaluation conditions.
  • Use a cycle only when the source documents an iterative loop.

Ask for whitespace, grouping, and short labels if readability matters. Avoid asking the image generator to produce dense paragraphs, exact values, or final citation text inside the visual.

Revise one dimension at a time

When the first draft is close, change one part of the prompt instead of replacing everything:

  • Tighten a relationship: “Show the evaluation stage after, not beside, preprocessing.”
  • Simplify the scope: “Remove supporting details that are not required for the main workflow.”
  • Improve hierarchy: “Make the primary path more prominent than optional branches.”
  • Clarify a sketch: “Preserve the three groups in the uploaded sketch, but redraw the connections from the verified brief.”

If you use a sketch, only upload material you own or are allowed to use. A sketch can guide structure; it does not remove the need to verify the generated labels and relationships.

Review the result as research communication

Use the AI Research Diagram Generator when your prompt names the real structure. Then review the output with the same care you would apply to a figure drafted by hand.

Check every label, relationship, fact, quantity, unit, and citation against the source. Confirm that the visual grouping does not overstate a connection, the arrows match the intended direction, and the final text is readable at its intended size.

For calculated charts, measured values, or statistical graphics, create the figure from verified data in the appropriate analysis or charting workflow. Use a generated research diagram for explaining a concept or process, not as evidence for a result.

Write the facts first, use the prompt to express the visual structure, and create a research diagram only after the brief is ready for review.